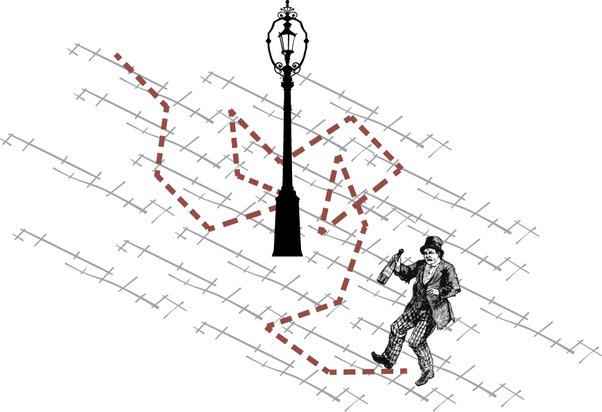
On a long enough time frame, markets seem to just go up. On a short enough time frame, some traders can read the tape to determine the actual market participants and their intentions (more power to them). Otherwise, do the markets just meander aimlessly like a chimp on shrooms? Countless attempts have been made to answer this question. There are certainly traders that just seem to invest/trade better than others, that are successful when the average trader is not…does this give credence to the idea that the walk isn’t random? That some have figured it out while others haven’t? OR, are they just part of the same normal distribution (some people also seem to lose EVERY trade they make) which may also describe the market as a whole? I don’t know, and if you did, you wouldn’t be reading this.
Every attempt that I’ve made to answer this question has led me to believe it’s random…or at least not predictable in a way that’s meaningful. Then why the heck are we here? Well, even if the market itself is a random walk, it’s undeniable that components of the market are inextricably linked. The Euro and Swiss Franc will move in a related way to the US dollar due to their geopolitical proximity. Brent Crude oil will move in a way that is related to how WTI crude oil moves, even though they’re extracted in different parts of the world. Given a lack of company specific news, if AAPL goes up, GOOG probably will too.
So while the market “may” be a random walk, the relative movements of these related products are not simply because they are acted upon by the same forces, be it dollar strength, oil demand, or tech speculation. While any individual stock, commodity or asset may exhibit randomness in their price movement, many assets meander together, some in lock-step, some just in the same general directions, some more or less aggressively than the others. How do we find these related products? That’s up to you, and is only limited by your imagination, intuition, and knowledge of world markets and how they relate to each other. What we provide is the mechanism by which you’re able to test your theories.
What do we do once we find these related products? The most basic implementation of this methodology is pairs trading, which has been a well used strategy on Wall St for decades. Traders find pairs of related stocks, calculate the variance of the historical divergences of their prices or returns, and when the stocks moved apart they buy one stock while selling the other in certain proportions. This would essentially mitigate market move risk … if the entire market tanked or rallied, one side of the trade would profit while the other lost. They’d only care about having the prices converge again and successful implementation of this strategy would allow traders to weather even the nastiest market sell-offs. Markets have certainly changed and evolved, and these pairs aren’t as easy to find now but the strategy still has merit, it just needs different applications. While it may be very difficult, if not impossible to find obvious stock pairs, we can apply the same logic to stocks across platforms or countries, to different asset classes (think international index futures), or even “alternative data” like weather data and corn yields. We are living in a time where data is readily available and the game now consists of finding creative ways to consolidate that data, slice it up, and interpret it. Easy access to the world marketplaces makes implementing these trades pretty simple.
While first impressions may lead us, understandably, towards correlated pairs…a more sophisticated approach could be to create a portfolio of multiple assets which would allow us to generate a correlation profile that suits us. If the S&P futures move in lock-step (which they should) with a basket comprised of all its constituent stocks, any arbitrage opportunities between the future and basket are too small, quick, and practically impossible for retail traders to take advantage of. But if we manipulate our basket to be slightly different than that of the index, we can decouple it just enough for us to exploit its divergences from the future in a mathematically predictable way. While trading all of the stocks in the S&P is not feasible for a retail trader, there is a preponderance of listed derivatives at our disposal…we can mirror the S&P with a basket of sector ETFs, you can effectively trade half of the Nasdaq100 with its top ten stocks, or half of the US Dollar Index with just EUR/USD…the permutations are virtually limitless.
Furthermore, correlation is not the only method of testing the relationship amongst time series. Testing for cointegration involves finding linear combinations of multiple time series that are stationary to a certain degree of confidence. This does not require us to trade one asset “against” another … it gives us a portfolio, or what I like to call a “synthetic,” such that its price is stationary … namely, if price of said portfolio diverges from its historic mean, we can expect it to converge with a degree of certainty. Stationarity is a quality of a series to stay the same, to not trend, and to have constant variance…essentially to not move up or down, and if it does, to move back regularly. Portfolios like this give us mathematically justifiable entry and exit points for our trades. So, is the market a random walk? Perhaps, perhaps not. This does not preclude us from creating synthetics or portfolios which follow a systematic pattern and which are not random. Divergences from these patterns give us trading opportunities and an ability to gauge our likelihood of success.